Drone survey mining volume calculation helps mining companies, quarry operators, contractors, and project owners measure stockpiles, excavation areas, overburden, cut-fill quantities, and site changes with faster aerial data. Instead of relying only on manual ground measurements, drone surveys can create maps, 3D models, digital surface models, and point clouds that support more structured volume reporting.
For mines and quarries in India, volume calculation is not just a technical exercise. It affects inventory records, production planning, contractor billing, royalty discussions, transport planning, reconciliation, and operational decisions. A small error in stockpile or excavation volume can create confusion across finance, operations, and management.
This guide explains how drone surveys support mining and quarry volume calculation, what methods are used, and what businesses should check before commissioning a drone survey.
What is drone survey mining volume calculation?
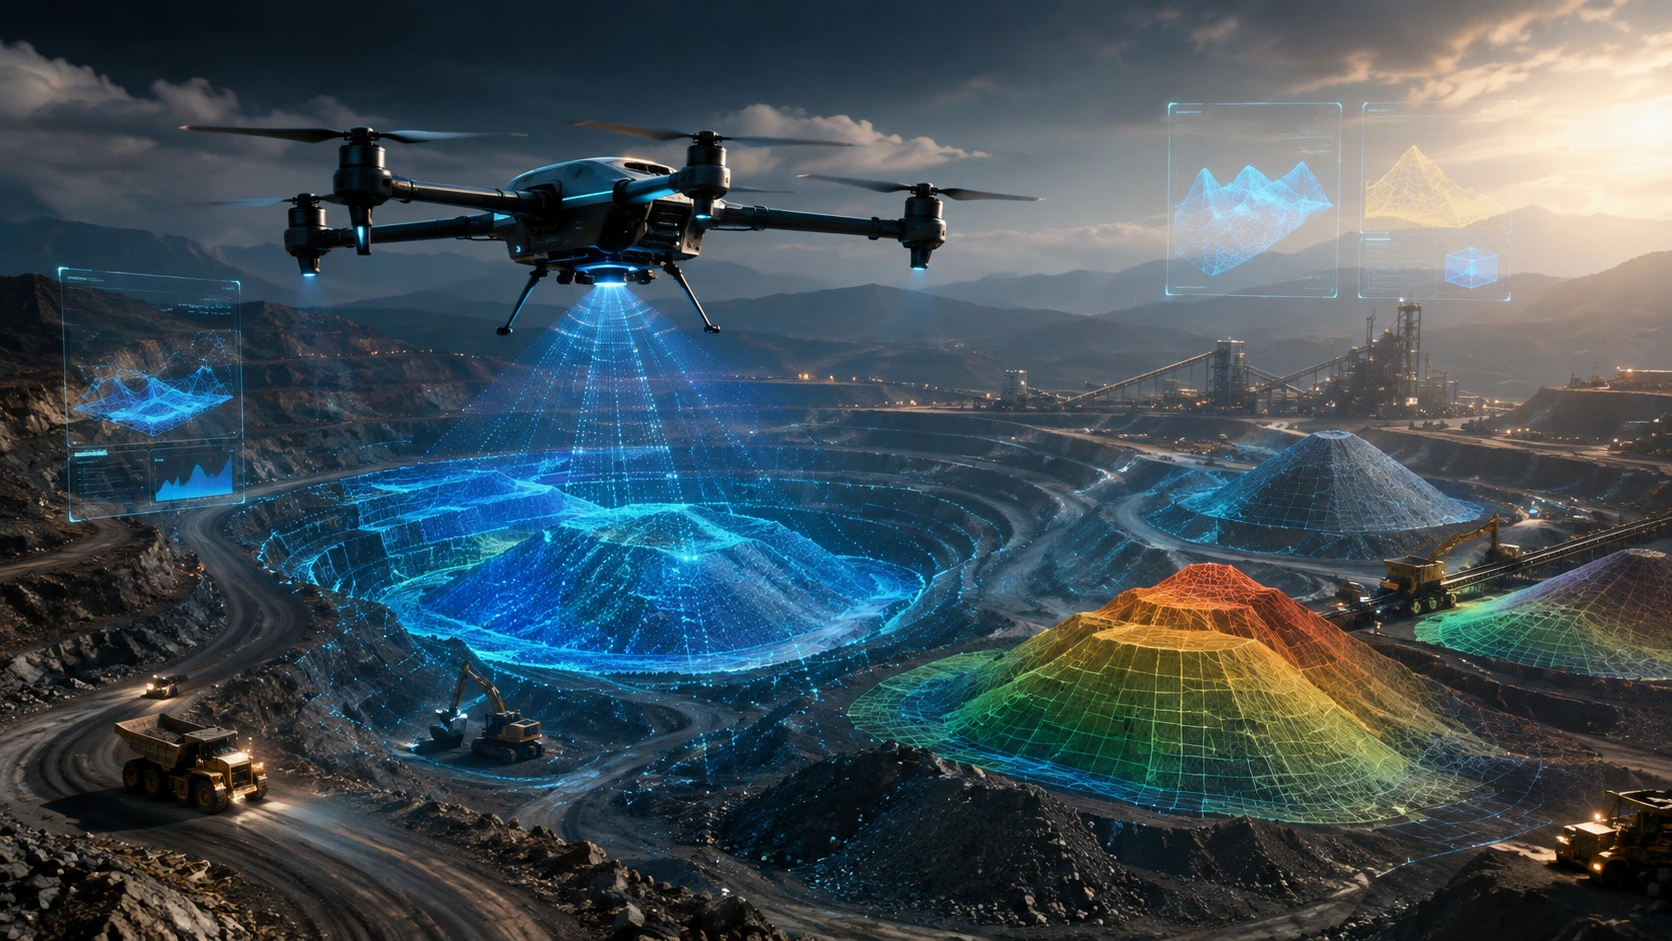
Drone survey mining volume calculation is the process of using drone-captured aerial data to calculate the volume of stockpiles, excavation pits, cut-fill areas, quarry benches, and mined material. The drone captures the site from above, and the data is processed into measurable 3D surfaces.
A mining or quarry drone survey may calculate volumes for:
- Aggregate stockpiles
- Sand and gravel piles
- Coal, stone, and mineral stockyards
- Overburden dumps
- Excavation pits
- Quarry benches
- Cut-fill zones
- Backfilled areas
- Earthwork progress
- Crusher plant stockyards
- Road formation inside mining sites
The basic idea is simple: the survey creates a 3D surface of the current site condition. That surface is compared with a base surface, previous survey, design level, or defined stockpile boundary. The difference between the surfaces is used to calculate volume.
Skyglimps Technologies LLP provides 2D Surveying & Mapping for organisations that need aerial mapping, site documentation, and survey-ready outputs for infrastructure, mining, land, and development projects.
Why are drones useful for mining and quarry volume measurement?
Drones are useful for mining and quarry volume measurement because they can capture large, uneven, and difficult-to-access sites quickly from the air. They reduce repeated manual movement across active stockyards, benches, slopes, and haul roads during initial measurement.
Mining and quarry sites are dynamic. Stockpiles change daily, excavation areas expand, haul roads shift, and material moves between extraction, processing, storage, and dispatch. Manual measurement can become slow and inconsistent when the site is large or frequently changing.
Drone surveys help mining teams:
- Measure stockpile volumes faster
- Track excavation progress
- Compare cut and fill quantities
- Maintain updated inventory records
- Reduce risky manual access to stockpile slopes
- Review changes across dates
- Improve contractor and production documentation
- Create visual evidence for management reports
- Support GIS and CAD workflows
Drones do not remove the need for professional survey control, engineering review, or reconciliation with weighbridge and production records. They improve the speed, visibility, and repeatability of volume measurement.
What data is captured during a mining drone survey?
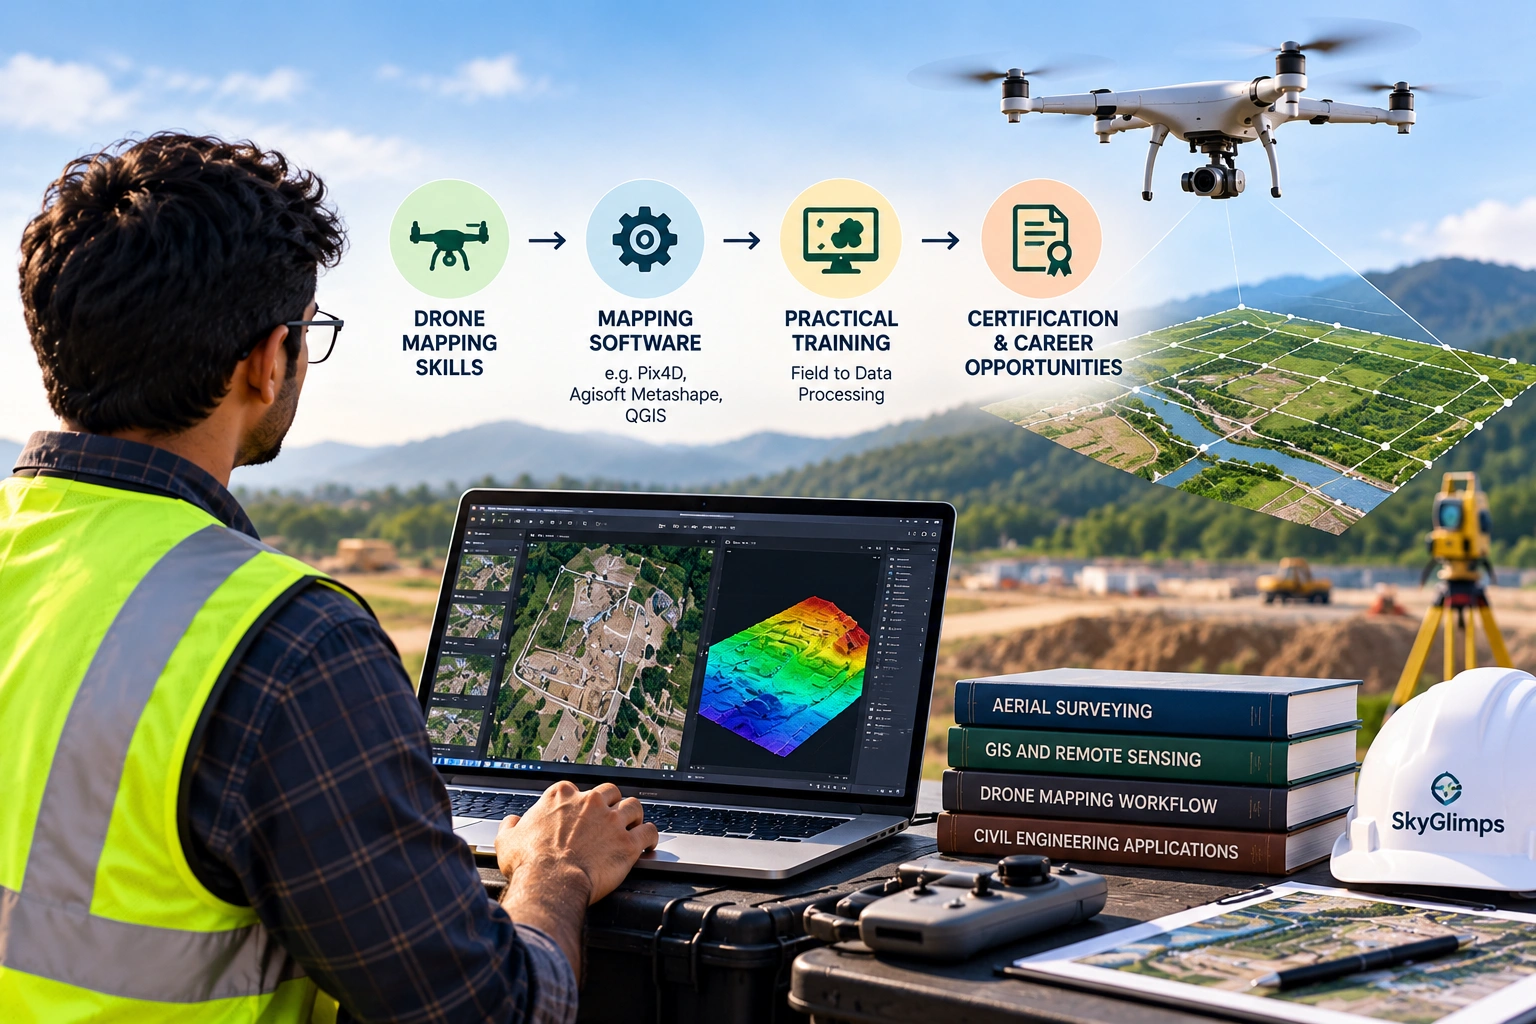
A mining drone survey captures overlapping aerial images, site videos, GPS-linked data, and sometimes LiDAR point clouds depending on the project requirement. This data is processed into orthomosaics, 3D models, point clouds, digital elevation models, and volume reports.
Common data and outputs include:
| Output | Use in mining volume calculation |
|---|---|
| Aerial images | Visual documentation of stockpiles and site condition |
| Orthomosaic map | Top-down measurable view of the quarry or mine area |
| 3D point cloud | Spatial data used for surface modelling |
| Digital Surface Model | Surface representation for volume computation |
| Digital Elevation Model | Terrain analysis where bare-earth modelling is needed |
| Contour map | Elevation and bench-level understanding |
| Cross-sections | Pit, slope, bench, and road review |
| Volume report | Stockpile, excavation, cut-fill, or dump calculation |
| GIS/CAD files | Integration with planning and engineering workflows |
The right output depends on the measurement objective. A stockpile inventory project may need an orthomosaic, 3D model, and stockpile-wise volume table. A quarry planning project may need contours, cross-sections, and cut-fill reports. A site with vegetation, complex slopes, or higher 3D requirements may need LiDAR-based data.
For more advanced terrain and 3D workflows, Skyglimps also provides 3D LiDAR & GIS Solutions for projects that need point clouds, elevation models, GIS-ready layers, and 3D spatial outputs.
How is stockpile volume calculated from drone data?
Stockpile volume is calculated by creating a 3D surface of the pile and comparing it with a base surface or boundary. The software estimates the space between the pile surface and the selected base to calculate cubic volume.
A typical stockpile volume workflow includes:
- Define the stockpile area.
- Capture overlapping drone images or LiDAR data.
- Process the data into a 3D model or point cloud.
- Create a digital surface model.
- Mark the stockpile boundary.
- Define the base surface.
- Calculate the volume above the base.
- Export a stockpile-wise volume report.
- Validate results using checkpoints or field records where required.
The base surface is important. If the base is defined incorrectly, the volume result can be misleading. For example, a pile on a sloped yard cannot always be calculated as if it sits on a flat surface. The software or survey team must use an appropriate base method.
Common stockpile base methods include:
| Base method | When it is used |
| Flat base | When the pile sits on a known level pad |
| Interpolated base | When the ground under the pile is estimated from surrounding edges |
| Previous surface | When comparing with an earlier survey |
| Design surface | When comparing against planned levels |
| Custom boundary base | When the surveyor defines a practical pile boundary |
The method should be documented in the report so the client understands how the volume was calculated.
How is cut-fill volume calculated in mines and quarries?
Cut-fill volume is calculated by comparing two surfaces: an existing surface and a reference surface. The reference may be a previous survey, design surface, approved quarry plan, or target level.
Cut volume refers to material removed from an area. Fill volume refers to material added to an area. In mining and quarry operations, this can help track excavation progress, backfilling, bench development, haul road formation, and earthwork movement.
A cut-fill workflow usually includes:
- Current drone survey
- Previous survey or design surface
- Surface alignment and coordinate check
- Cut-fill comparison
- Volume table generation
- Map or colour-coded output
- Cross-section review
- Field validation where required
Cut-fill maps are useful because they show not only the total quantity but also where the changes happened. A colour-coded map can show excavation zones, filled areas, overcut sections, undercut sections, and areas that need further work.
For contractors and project owners, this helps reduce disputes because the measurement is linked to a dated survey record.
What is the role of ground control, RTK, and PPK?
Ground control, RTK, and PPK improve the reliability of drone survey positioning and help verify the accuracy of volume calculation outputs. They are especially important when volume data affects payment, inventory, planning, or compliance decisions.
Drone survey accuracy depends on how well the aerial data is positioned in the real world. If the model shifts horizontally or vertically, volume calculations may be affected.
Key terms include:
| Term | Meaning | Why it matters |
| GCP | Ground Control Point with known coordinates | Helps align drone data to real-world positions |
| Checkpoint | Independent known point used for verification | Helps test final accuracy |
| RTK | Real-time positioning correction during flight | Improves live drone positioning |
| PPK | Post-processed correction after flight | Improves positioning during processing |
| Coordinate system | Spatial reference used for survey data | Ensures compatibility with project records |
For mining volume calculation, vertical accuracy is especially important because volume depends on surface elevation. Even small height differences can affect results across large stockpiles or excavation areas.
A professional drone survey report should mention the control method, assumptions, and limitations.
Which method is better: photogrammetry or LiDAR?
Photogrammetry is often suitable for visible stockpiles, open quarry surfaces, and regular inventory surveys, while LiDAR is stronger for complex terrain, vegetation, steep slopes, and detailed 3D surface capture. The right method depends on site conditions and deliverables.
Photogrammetry uses overlapping images to create maps and 3D models. It is widely used for stockpile measurement and quarry documentation when surfaces are visible and lighting conditions are suitable.
LiDAR uses laser scanning to create dense 3D point clouds. It can be more useful when the site has vegetation, complex slopes, elevation-critical areas, or a need for stronger terrain modelling.
A practical comparison:
| Factor | Photogrammetry | LiDAR |
| Data source | Overlapping RGB images | Laser scanning |
| Best for | Visible stockpiles and open sites | Complex terrain and vegetation-aware workflows |
| Output | Orthomosaic, 3D model, DSM, point cloud | Dense point cloud, terrain models, 3D data |
| Visual clarity | Strong | Often combined with RGB |
| Processing complexity | Moderate | Higher |
| Cost | Usually lower | Usually higher |
| Use case fit | Routine stockpile measurement | Advanced terrain and 3D survey needs |
Many mining and quarry projects can begin with photogrammetry. LiDAR becomes useful when the terrain or accuracy requirement demands a stronger 3D workflow.
What affects the accuracy of mining volume calculations?
The accuracy of drone survey mining volume calculation depends on flight planning, ground control, camera quality, LiDAR quality, image overlap, surface visibility, weather, processing workflow, and the chosen volume method. Poor planning can create weak outputs even with good equipment.
Important accuracy factors include:
- Flight altitude
- Image overlap
- Ground sampling distance
- Camera calibration
- LiDAR point density
- GNSS positioning
- GCP and checkpoint quality
- Surface visibility
- Stockpile boundary selection
- Base surface method
- Weather and lighting
- Dust and moving machinery
- Processing settings
- Coordinate system
- Quality control process
Stockpiles with sharp edges, steep slopes, shadowed faces, reflective material, or active machine movement can be harder to model. Survey timing should be planned when the site is safe, stable, and suitable for capture.
For repeat surveys, using a consistent workflow is important. If one survey uses a different boundary, base method, control system, or processing approach, comparisons may become less reliable.
What deliverables should a mining volume report include?
A mining volume report should include stockpile boundaries, volume tables, survey date, methodology, maps, 3D views, control information, assumptions, and quality notes. The report should be clear enough for operations, finance, survey, and management teams to use.
A professional report may include:
| Report element | Purpose |
| Survey summary | Explains scope and site coverage |
| Orthomosaic map | Shows stockpile and site layout |
| Stockpile boundary map | Shows how each pile was defined |
| Volume table | Lists pile-wise or zone-wise quantity |
| 3D model view | Gives visual understanding of pile shape |
| Cut-fill map | Shows excavation and fill changes |
| Cross-sections | Supports pit, bench, and slope review |
| Control method | Explains GCP, RTK, or PPK workflow |
| Assumptions | Clarifies base surface and boundaries |
| Limitations | Explains conditions affecting accuracy |
| File exports | Supports GIS, CAD, or internal records |
A volume report should not only give one final number. It should explain how that number was calculated and what areas were included. This is especially important when the result is used for inventory, billing, or production planning.
For recurring site records, drone-based documentation and progress tracking can help mines and quarries maintain dated survey records over time.
How often should mines and quarries conduct drone volume surveys?
Mines and quarries should conduct drone volume surveys based on production frequency, inventory needs, billing cycles, compliance requirements, and management reporting schedules. High-activity sites may need more frequent surveys than low-volume sites.
Common survey intervals include:
- Weekly inventory checks
- Fortnightly production review
- Monthly stockpile reporting
- End-of-month reconciliation
- Before and after major dispatch
- Before contractor billing
- After major excavation work
- Before audit or compliance review
- Before site expansion planning
The best frequency depends on how quickly material moves. If stockpiles change daily and the business needs close inventory control, more frequent surveys may be justified. If changes are slower, monthly or milestone-based surveys may be enough.
The key is consistency. Regular surveys using the same method make it easier to compare volumes over time.
How should mining teams choose a drone survey partner?
Mining teams should choose a drone survey partner by checking survey experience, volume calculation workflow, control methods, safety process, deliverable formats, and reporting clarity. The partner should understand both drone mapping and mining site realities.
Ask these questions before hiring:
- Have you handled mining, quarry, or stockpile surveys before?
- What volume calculation method will you use?
- Will you use GCPs, RTK, PPK, or checkpoints?
- What accuracy checks will be performed?
- Can you provide stockpile-wise volume tables?
- Can you deliver GIS or CAD-ready files?
- Can repeat surveys be compared over time?
- How will you handle active machinery and site safety?
- What assumptions will be documented?
- What file formats will be delivered?
A professional drone survey partner should not simply fly the site and share photos. The real value lies in measurable outputs, documented methodology, and decision-ready reporting.
For mining, quarry, and infrastructure-related use cases, Skyglimps also supports drone workflows across mining and infrastructure where aerial mapping and site documentation can support operational visibility.
Why choose Skyglimps Technologies for mining and quarry drone surveys?
Skyglimps Technologies LLP is a Kolkata-based drone services company and DGCA-certified Remote Pilot Training Organisation serving government and enterprise clients across Eastern India. The company supports drone-enabled workflows across surveying, mapping, LiDAR, GIS, inspections, documentation, surveillance, and training.
Skyglimps Technologies, a DGCA-certified RPTO in Kolkata, is positioned for organisations that need structured aerial data for mining, quarry, infrastructure, construction, road, and industrial projects.
For mines and quarries in Kolkata, West Bengal, Jharkhand, Odisha, and Eastern India, local coordination can help improve site scoping, field execution, repeat monitoring, and reporting workflows. Drone survey mining volume calculation works best when the survey is planned around the final decision: inventory, billing, production review, cut-fill analysis, or site planning.
FAQ: Drone Survey Mining Volume Calculation
Drone survey mining volume calculation uses drone-captured maps, point clouds, and 3D models to calculate stockpile, excavation, cut-fill, and quarry material volumes.
Drones capture aerial data, which is processed into a 3D surface. The stockpile surface is compared with a base surface or boundary to calculate volume.
Photogrammetry is often suitable for visible stockpiles and open quarry areas. LiDAR may be better for complex terrain, vegetation, or higher 3D modelling requirements.
4. Why are GCPs or checkpoints important?
GCPs and checkpoints help align and verify drone survey data. They improve confidence in measurements, especially when volumes affect billing, inventory, or planning.
Yes. Drone surveys can compare current and previous surfaces, or current and design surfaces, to calculate cut-fill quantities across excavation and fill areas.
Deliverables may include orthomosaic maps, 3D point clouds, DSMs, DEMs, contour maps, cross-sections, stockpile volume tables, cut-fill maps, and PDF reports.
Survey frequency depends on site activity, inventory needs, dispatch cycles, billing, and management reporting. Many sites use weekly, monthly, or milestone-based surveys.
Measure mining and quarry volumes with better aerial data
Drone survey mining volume calculation helps mines and quarries measure stockpiles, excavation, overburden, cut-fill, and site changes with better speed and visibility. It turns aerial data into measurable outputs that support inventory, production planning, contractor review, and management reporting.
For mining and quarry operations in Kolkata, West Bengal, Jharkhand, Odisha, and Eastern India, drone surveys can improve how teams monitor material movement and maintain site records.
If your organisation needs stockpile measurement, quarry mapping, cut-fill reports, 3D models, GIS-ready outputs, or recurring mining site documentation, connect with Skyglimps Technologies LLP through the 2D Surveying & Mapping service page and share your site location, survey objective, material type, and required deliverables.